
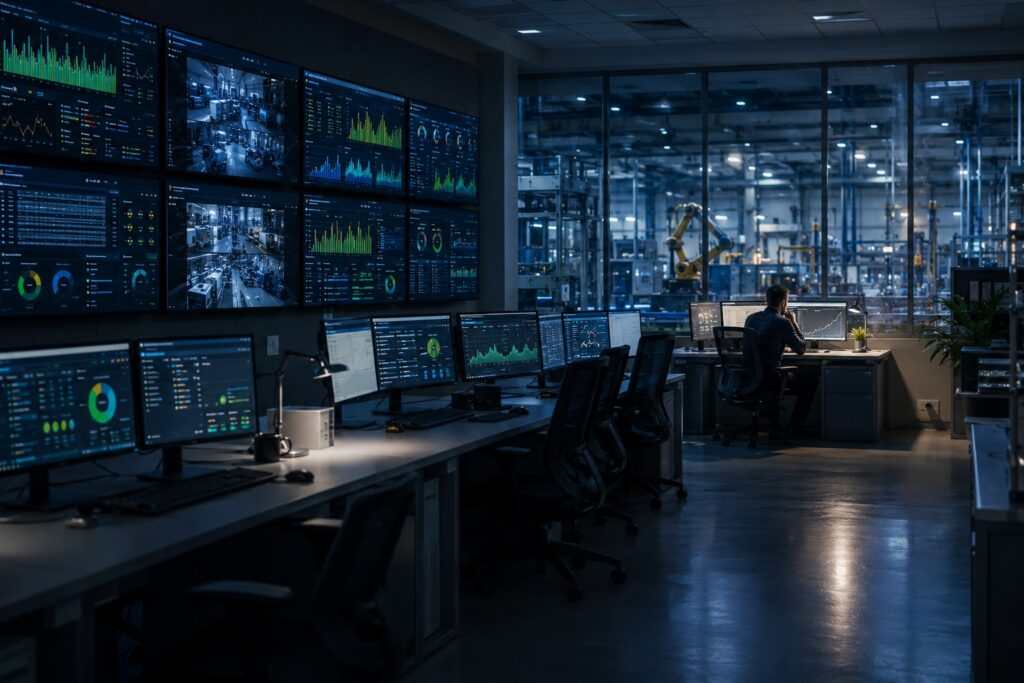
There was a time when a great dashboard was a competitive advantage.
A real-time view of production. KPIs cascaded across the leadership team. Reports that landed on Monday morning with last week’s results neatly summarized. For a long time, that was modern operations.
It is not anymore.
The world has changed faster than the reporting model. Data is generated continuously. Conditions shift hour by hour. The cost of a missed signal compounds every shift it goes unanswered. And the bottleneck is no longer the data. It is the human in front of the dashboard who is supposed to notice the problem before it becomes one.
Most manufacturers have not caught up. They are still building dashboards. Still scheduling reports. Still hiring analysts to compress the gap between what the data says and what the team can do about it.
This is the old model. And it is leaking margin every day.
Here are eight ways the dashboard-and-report paradigm is failing manufacturers right now, and the shift that closes each one.
1. Dashboards Are a Question, Not an Answer
Every dashboard you built is still waiting for someone to check it before margin bleeds out.
The plant manager has three meetings before lunch. The quality lead is on the floor handling an escape. The production supervisor is dealing with a callout. Nobody is staring at your dashboard. Meanwhile, the anomaly that was visible at 9:00 AM went unnoticed until 2:00 PM and is now a scrapped run.
The dashboard did its job. It showed the data. The problem is that “showing the data” is not the same as catching the problem.
The shift: Stop hoping someone is watching. Let the system watch continuously, detect conditions, and run a defined response. The dashboard is the question. The agent is the answer.
A dashboard that requires a human to check it is not monitoring. It is hoping.
2. Reports Are Yesterday’s Decisions
Every weekly report is a record of decisions you could have made days earlier.
Last week’s scrap was up 12%. On-time delivery slipped. Two customers had complaints. The leadership team reviews it on Monday. They ask the right questions. They assign the right follow-ups. But the week is already gone. The cost is already in the financials. The customer is already frustrated.
The same data could have triggered action on Tuesday. Or Wednesday. Or the moment the first anomaly showed up. Instead, it sat in a database until Monday morning.
The shift: Stop compiling reports and reviewing them on a cadence. Monitor the data continuously and trigger response playbooks the moment conditions are met. Act before the week ends, not after.
A weekly report is a record of all the decisions you did not make in time.
3. Your Senior Engineer Is Not a Pattern Detector
You are paying expert wages for vigilance work that a system should be doing for free.
The most experienced engineer in your operation starts the day the same way every morning. Open the BI tool. Pull up the production dashboard. Scan the trends. Forty minutes of high-paid eyes on a screen before the real engineering work begins. If they have time.
Humans are slow pattern detectors. We get tired. We get distracted. We miss the subtle drift because we are scanning for the obvious anomaly. A system that watches the data continuously does not get tired. It catches the 2% drift that a human eye would have missed until it became a 15% problem.
The shift: Let the system do the detection. Let your engineers do the engineering. When something needs human judgment, the system brings it to them with full context.
If your senior engineer’s first job every morning is watching a dashboard, you are paying expert rates for clerk work.
4. Alert Fatigue Is the New Information Overload
More notifications, fewer responses. That gap is where margin disappears.
Your team gets 200 alerts a day. By alert 50, people stop reading them. By alert 100, they get filtered to a folder. By alert 200, the rule is created to auto-dismiss them. The system is “monitoring.” Nobody is responding.
And the cost is not just ignored alerts. It is the one real alert that gets buried with the other 199. The bearing temperature spike that mattered. The supplier delay that needed action. The quality trend that was a leading indicator of an escape. All filtered out with the noise.
The shift: Stop firing alerts and trusting humans to triage. Tie every alert to a playbook. The response runs automatically when the condition is met. Humans see only what requires their judgment.
An alert without a playbook is not monitoring. It is noise with a notification.
5. The Cost of “I Meant to Check That”
Every missed check has a price tag. Your operation is paying it right now.
Most quality escapes do not happen because nobody knew. They happen because nobody checked. The data was there. The dashboard would have shown it. But the supervisor was pulled into a customer call. The quality lead was on a different floor. The engineer meant to circle back after lunch and never did.
“I meant to check that.” Four words that show up in nearly every root cause investigation. It is not negligence. It is reality. There are not enough hours, not enough eyes, and not enough mental bandwidth to check every dashboard, every alert, every trend every time it matters.
The shift: Build the check into the system. Run it continuously. Trigger the response automatically. Remove the dependency on human memory entirely.
The most expensive sentence in your operation is “I meant to check that.”
6. Static KPIs in a Dynamic Operation
The targets you set last year are catching last year’s problems while this year’s drift goes invisible.
Scrap target set in January. On-time delivery target set in January. First-pass yield target set in January. Reviewed in April. In between, the operation has shifted. A new customer brought tighter tolerances. A supplier change introduced material variation. A process tweak made the old target too easy or too hard. But the dashboard still reads against the January numbers.
The numbers catch the problems the targets were designed for. Not the new problems the operation is actually facing. Static targets in a dynamic operation are blind to the changes that matter most.
The shift: Stop setting targets once a year. Let the monitoring system track baseline behavior continuously. Detect drift from normal, not just from arbitrary targets. Trigger the playbook when the data changes, not when the calendar does.
A target set in January cannot see the drift that started in March.
7. The Dashboard That Lies By Omission
Your dashboard is showing you everything that was measured. The problem is what was not.
The dashboard looks clean. Green across the board. No alerts. Then the customer call comes in. A defect made it through. When the team digs in, the data was never wrong. It just was not there. The defect mode that caused the escape was not being tracked. The check that would have caught it was not on the dashboard.
The operation has thousands of variables. The dashboard has 20. The other 980 are still happening. And occasionally, one of them is where the problem lives.
The shift: Stop constraining detection to what someone decided to graph. Let the monitoring system observe all available data continuously. Detect anomalies in any signal, not just the ones a human thought to track. Surface the unexpected, not just the planned.
The metrics on your dashboard are the ones you remembered. The ones that hurt you are the ones you forgot.
8. You Cannot Hire Your Way to Real-Time
Adding analysts does not fix latency. It just makes the delay more expensive.
The data lag is killing you. So leadership does the obvious thing. Hire another BI analyst. Add another data engineer. Stand up another team. Six months later, the reports come out a day sooner, the dashboards refresh an hour faster, and the cost line is significantly higher. The latency is still there. It just costs more.
Humans pulling, transforming, analyzing, and reporting data will always be slower than the operation that generates the data. You cannot hire enough people to close that gap. You can only change who is doing the work.
The shift: Stop scaling headcount to compress data-to-decision time. Move detection, analysis, and response into the system itself. Use agents to handle the work humans were never going to do fast enough. Let your analysts focus on the questions that actually require human judgment.
You cannot hire your way to real-time. You can only architect for it.
The Common Thread
Every one of these eight problems shares the same root cause.
The dashboard-and-report model assumes that humans are the detection layer. That someone will check the screen. That someone will read the report. That someone will respond to the alert. That someone will remember the check.
But humans are not built for vigilance work. We are built for judgment. And every minute we spend looking for problems is a minute we are not spending solving them.
The old model is to compensate. Build more dashboards. Add more analysts. Send more alerts. Hold more meetings to review what the dashboards already showed.
The new model is to change the architecture entirely. Let the system watch. Let it detect. Let it respond. Surface only what requires a human, with context already attached.
That is what the next generation of operations looks like. Not more dashboards. Not faster reports. Not bigger analytics teams.
Continuous monitoring, response playbooks, and agents that act on the data the moment it arrives.
The dashboard is not dead because it was wrong. It is dead because the operation moves faster than anyone can watch.
If any of these eight problems sound familiar, let’s talk. Not a sales pitch. A conversation about what your operation is missing while everyone is busy watching the screen.
